Data Visualization & UI Design
Atolla Data Visualization
Atolla, an MIT-based skincare startup powered by Machine Learning, creates a personalized serum for each user. With Atolla's skin analysis kit, the user will have a holistic view of skin across different significant factors and get a 5-digit skin sequence as a representation of the skin condition. In this project, I helped the brand with data visualization, converting complicated skin factors information into a concise UI and creating skin-data-driven generative art as shareable content.
Client /
Atolla
Role /
Information Design
Team /
Kamin Phakdurong
Year /
2019
The Challenge
The Atolla holistic view of skin mainly includes six factors: top skin concern, skin sensitivity, oil, moisture, pH, and sun sensitivity. Not every index will change over time with clear health goals and the ranges can vary from data to data. To help users understand different skin factors with an optimistic attitude towards their skin concerns, the information needs to be both informative and playful.
Design Iteration
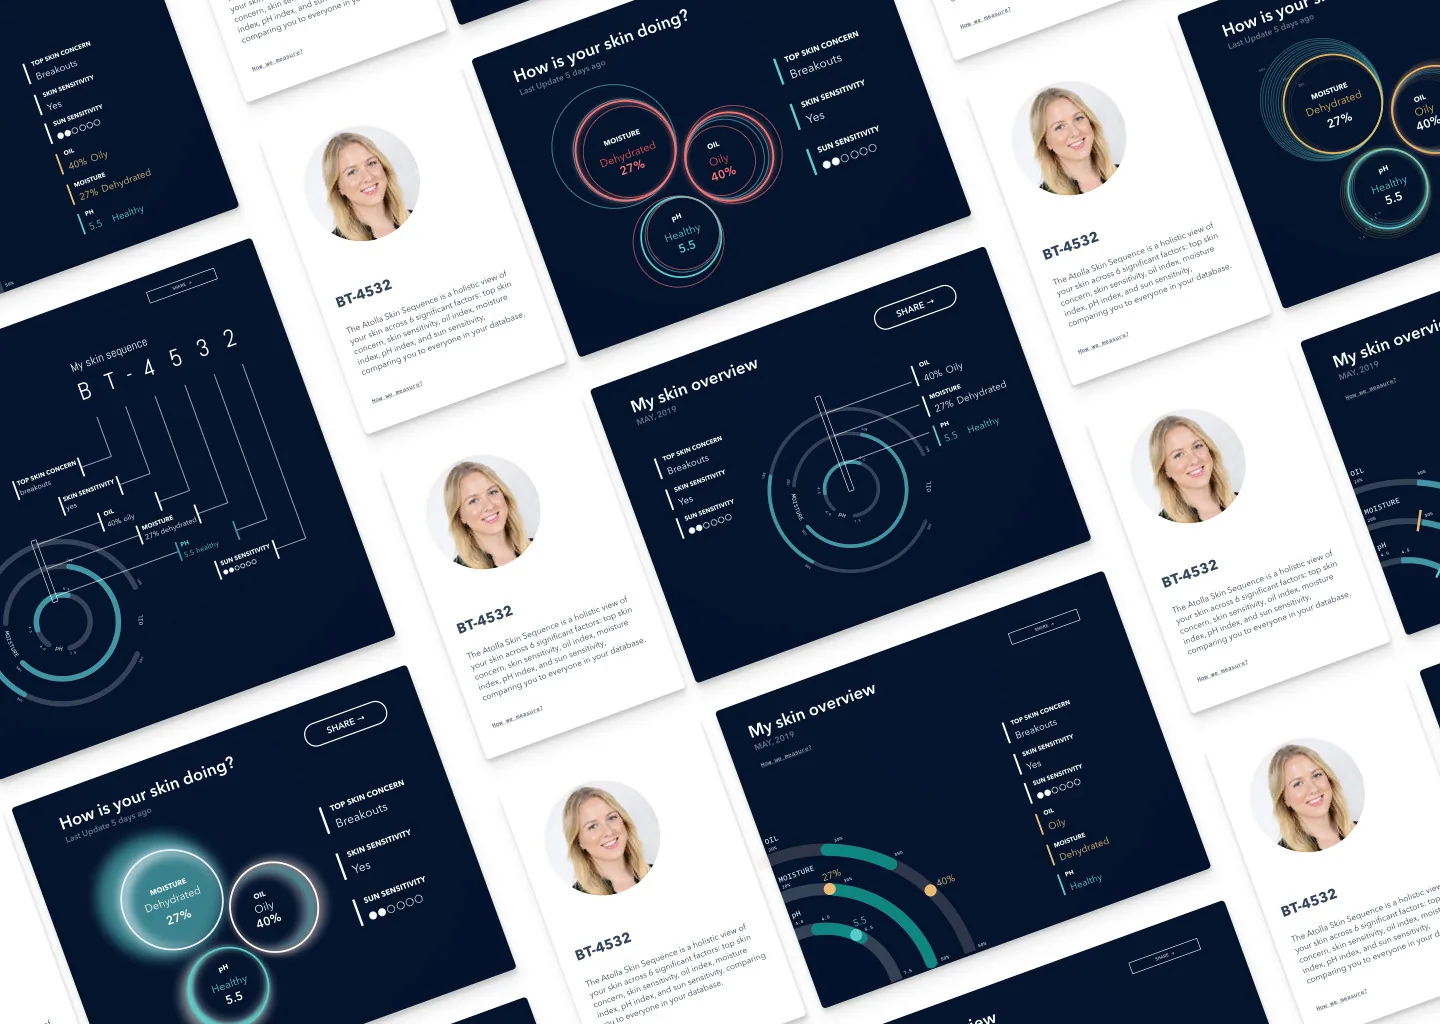
Around 20 design concepts with various charts were made to seek the best solution.
Solution
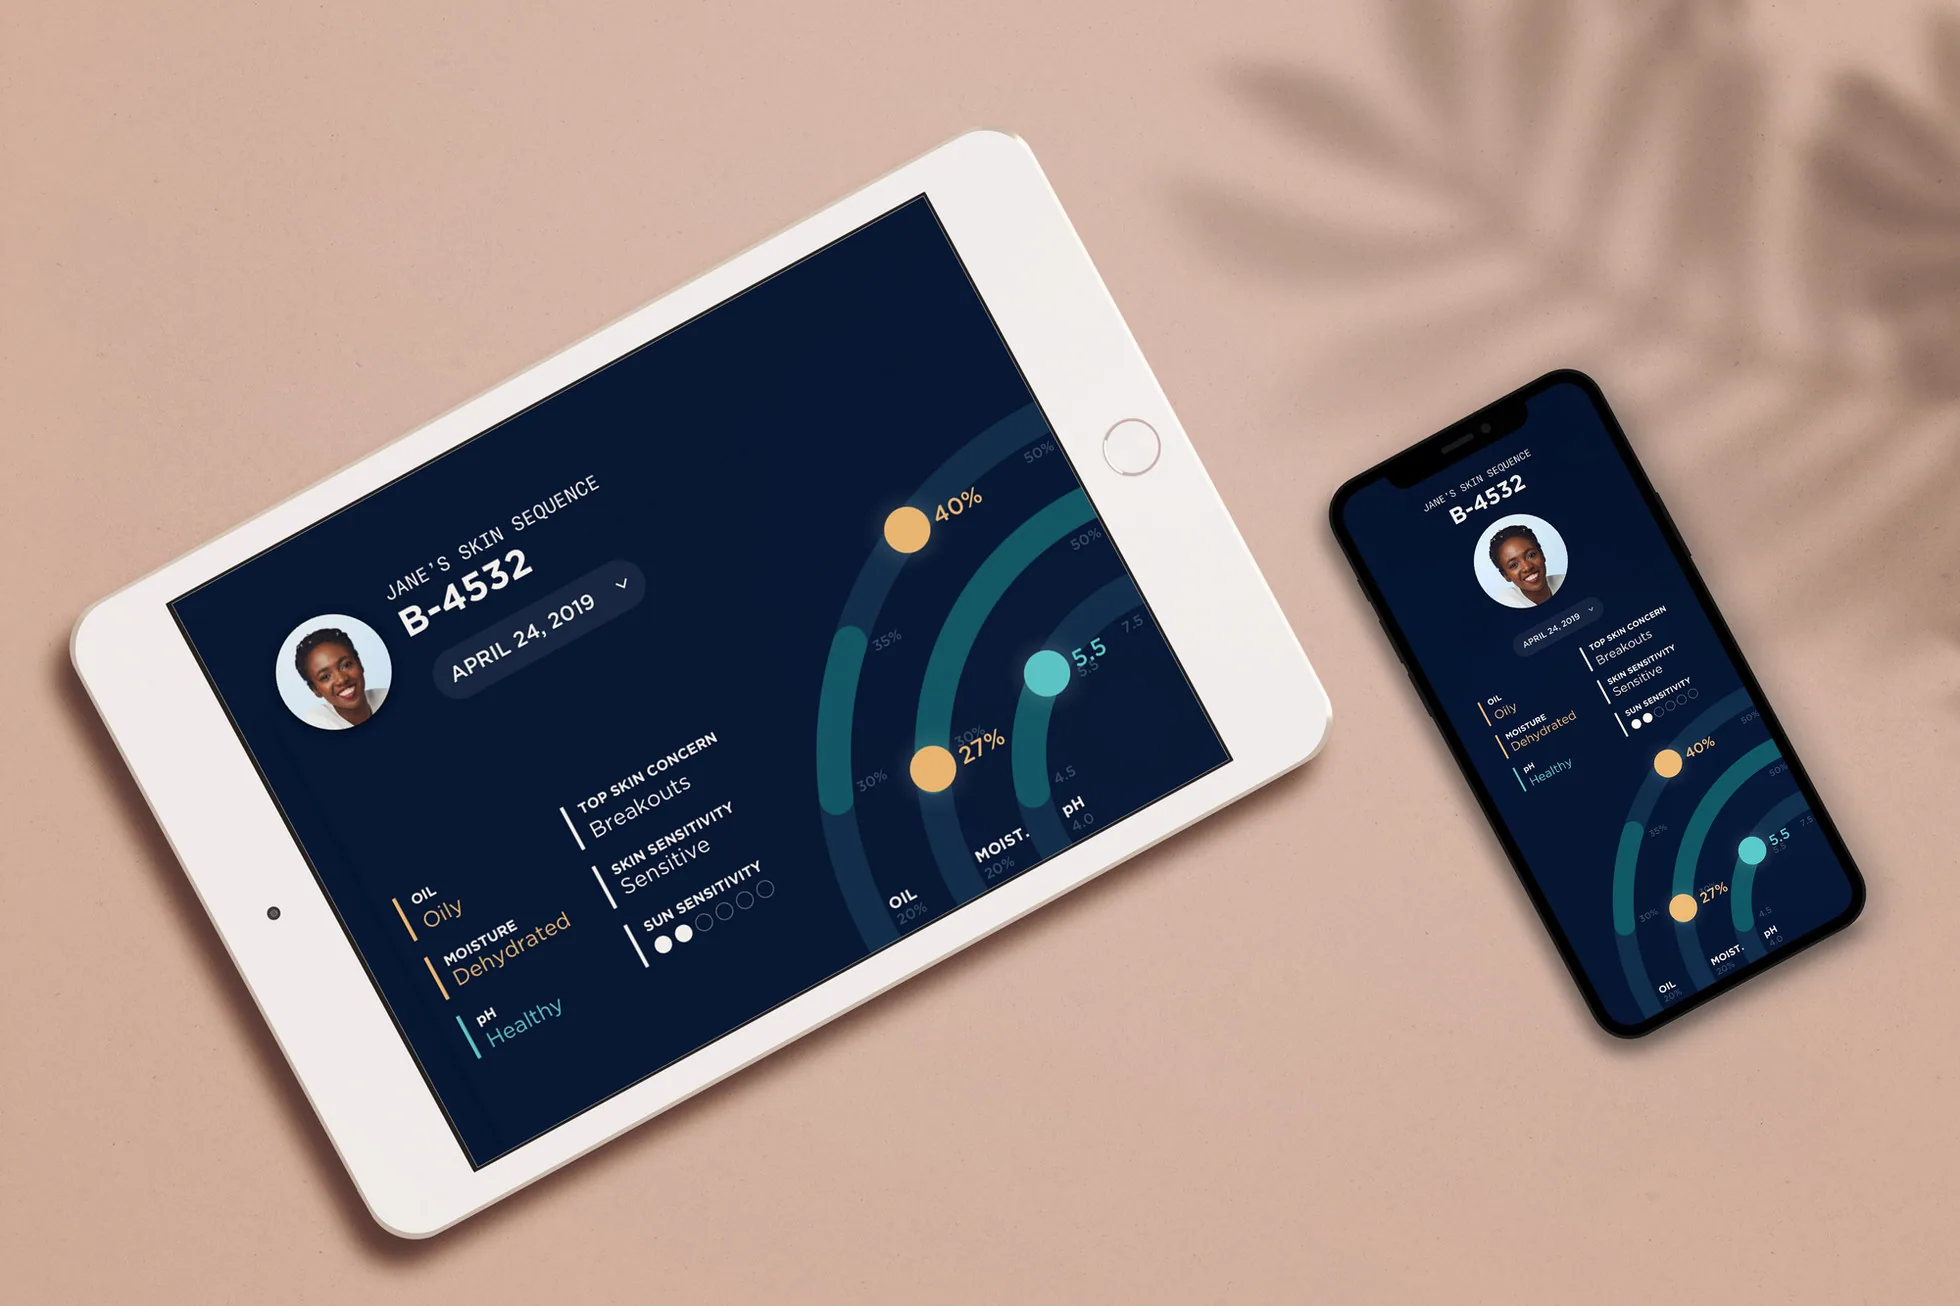
The final design separated numerical data from categorical data and visualized numerical data in three creative bar charts with healthy condition information highlighted by different colors.
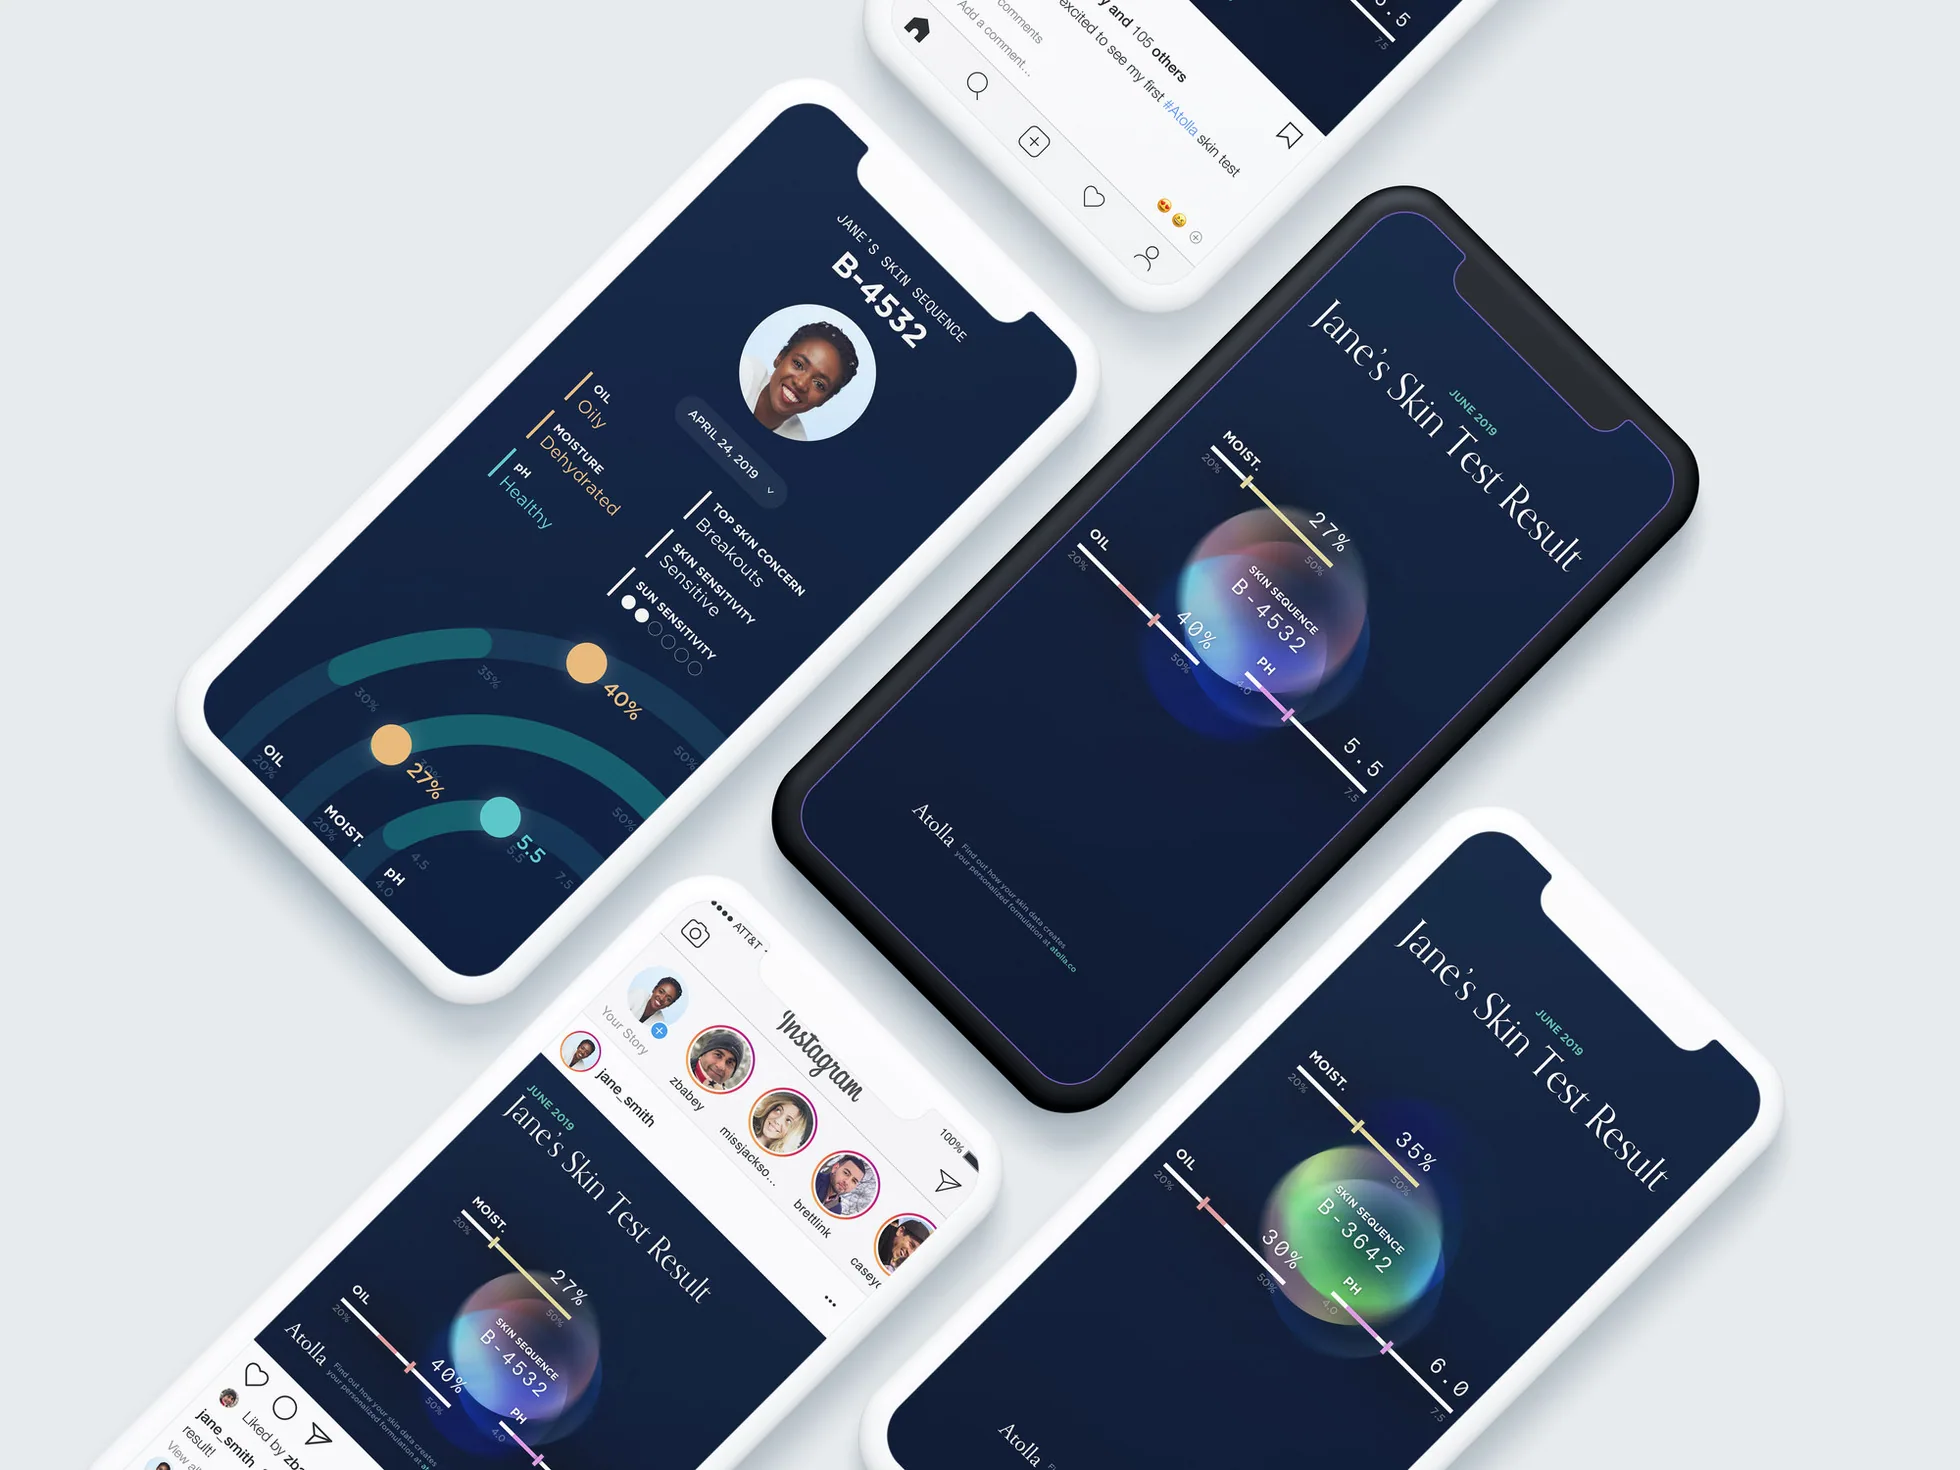
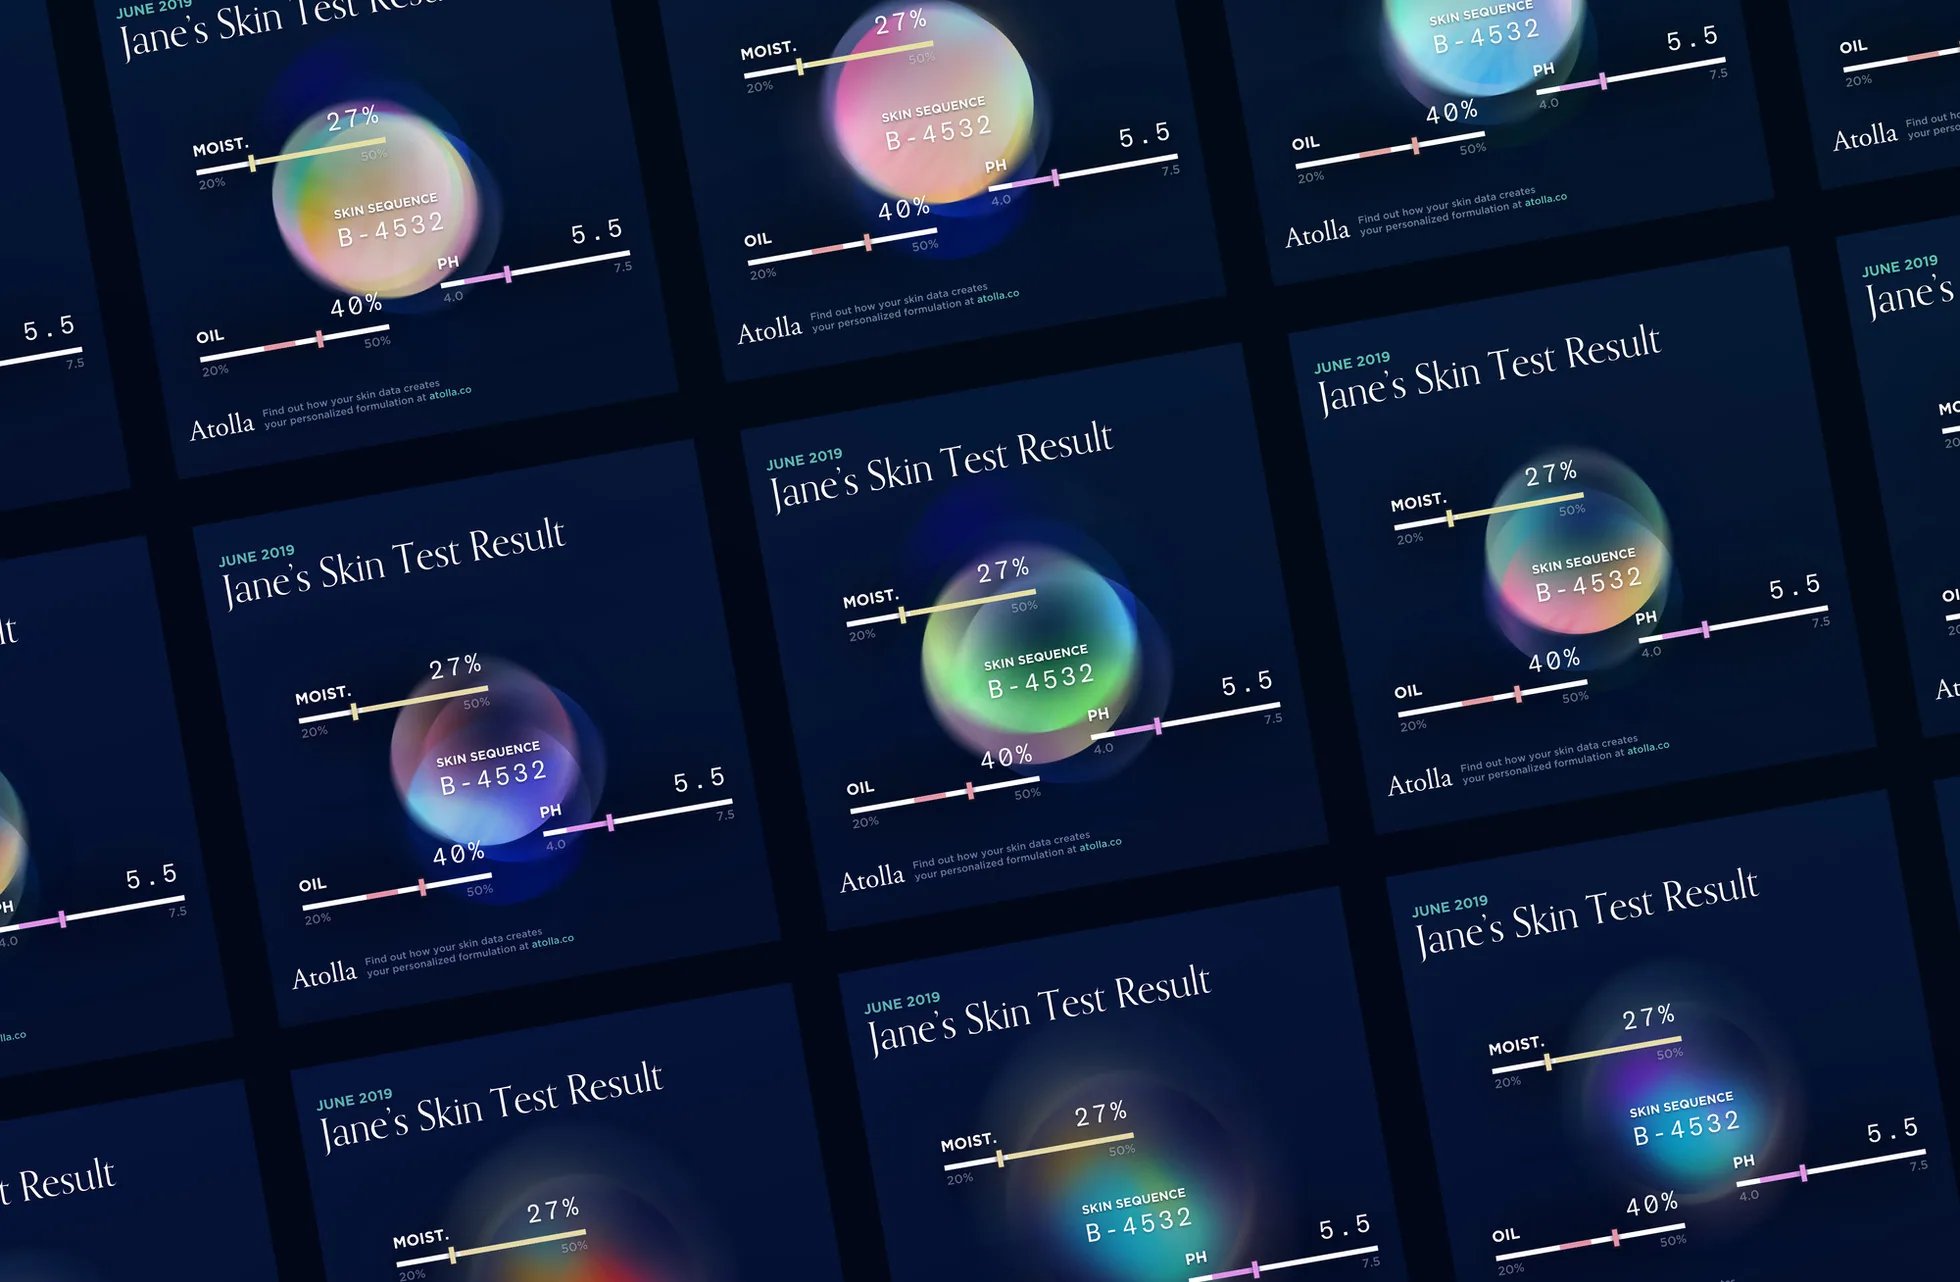
Based on the skin condition data, a piece of unique generative art is created, transferring the skin health issue into a brand new city lifestyle that can be shared on social media.
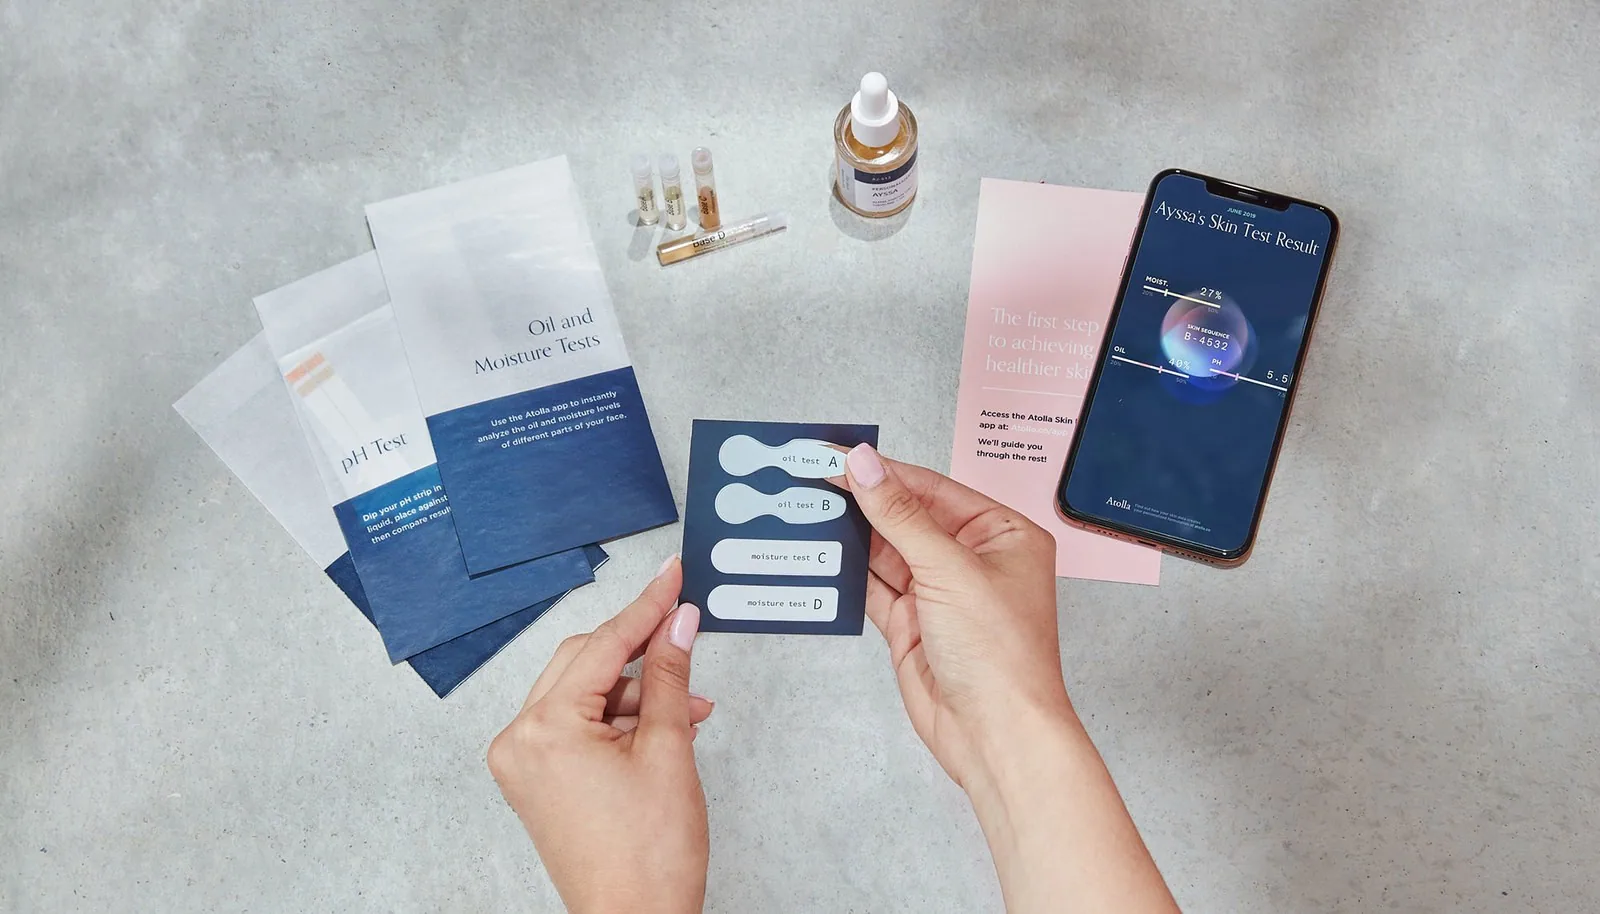
Courtesy of brand
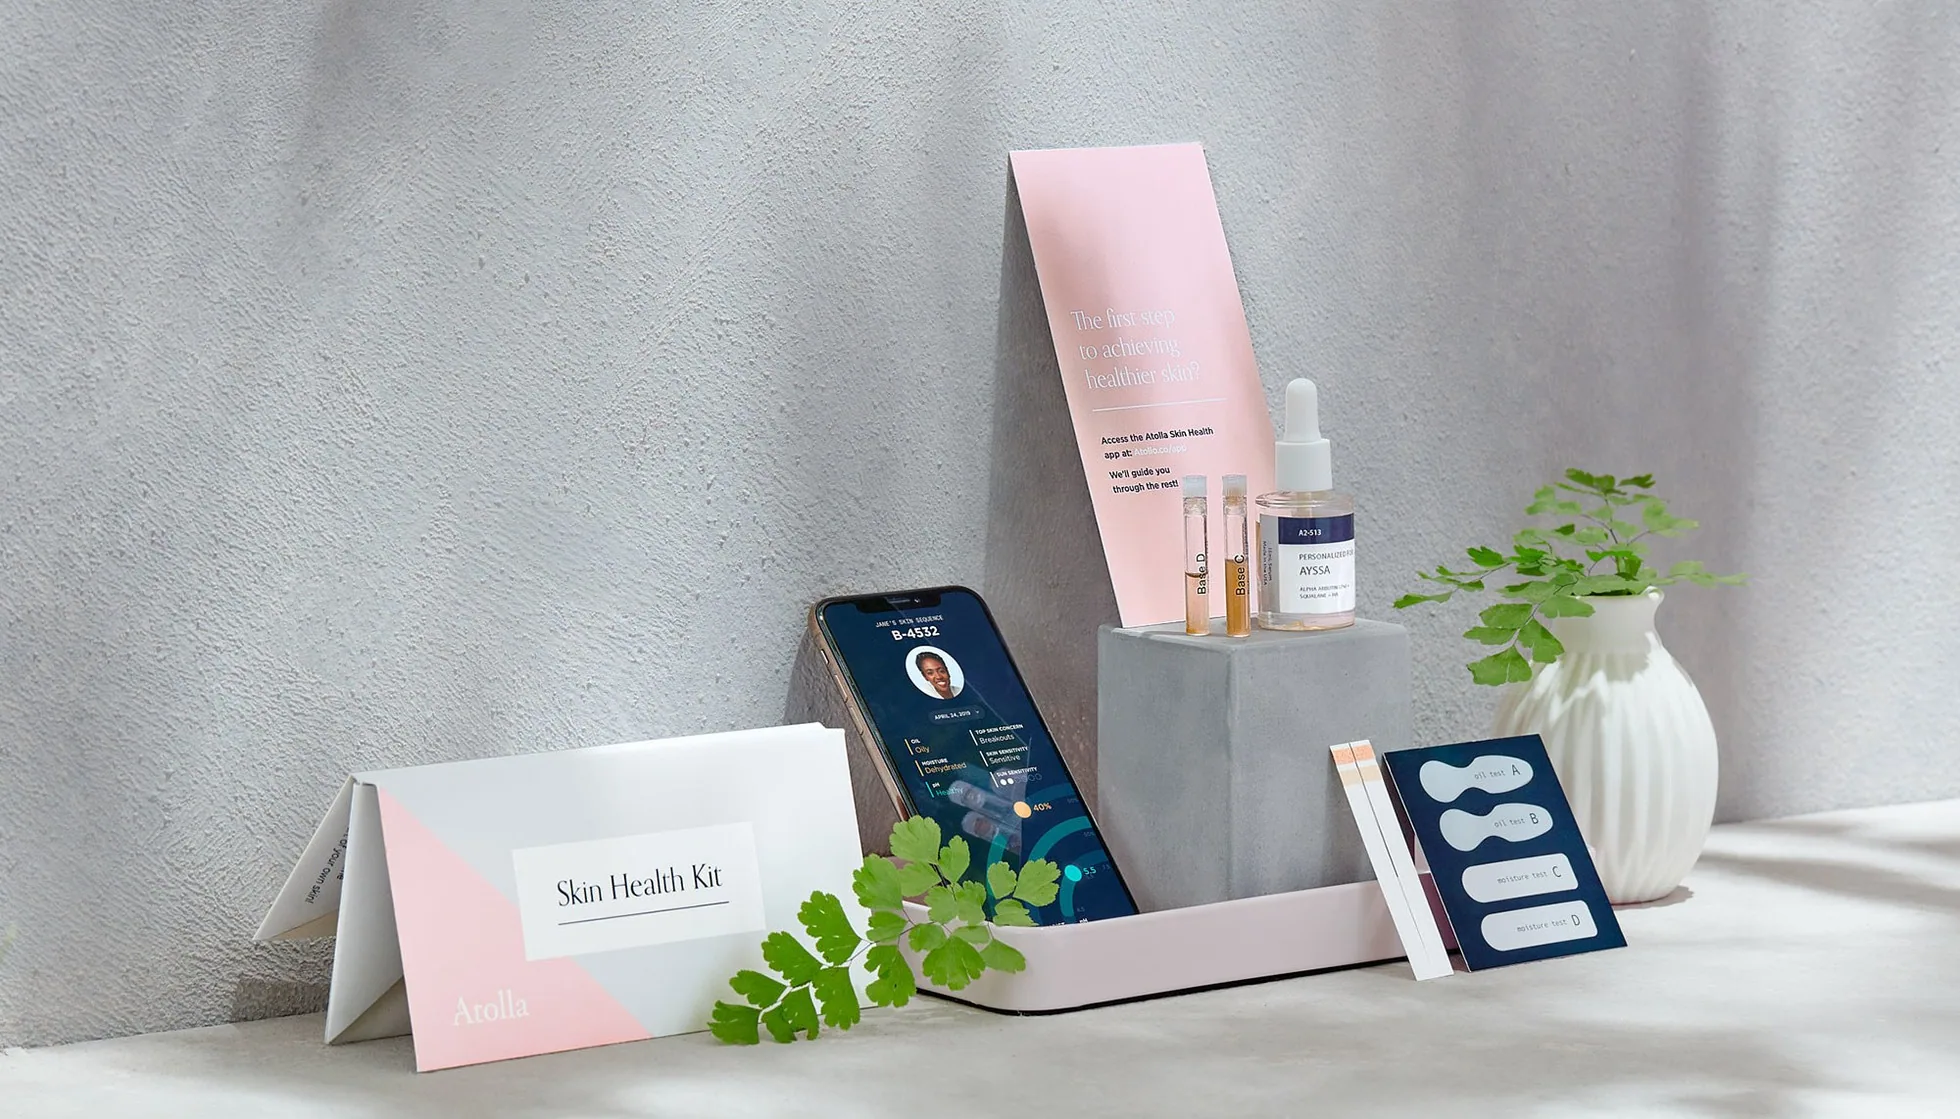
Courtesy of brand